1. INTRODUCTION
Articles containing infographics receive 72% more views than text‑only posts. Yet most website owners treat infographics as mere decoration – a pretty picture tacked onto a blog without any strategic thought. In 2026, when Google’s algorithms are smarter than ever at understanding visual content, a properly optimised SEO infographic is one of the most powerful link‑building and traffic‑generating assets you can create.
An SEO infographic isn’t just a graphic; it’s a visual story that simplifies complex data, attracts backlinks from other sites, and sends strong relevance signals to search engines. When done right, it can rank in Google Images, appear as a rich result, and even earn featured snippet spots.
In this guide you’ll learn:
- What makes an infographic “SEO‑friendly” and why it matters in 2026.
- A step‑by‑step process to create an infographic that search engines can read.
- The best free and paid design tools (no designer required).
- On‑page optimisation techniques: file names, alt text, and schema markup.
- Promotion strategies that turn your infographic into a backlink magnet.
Let’s turn data into visual assets that Google loves.
2. WHAT ARE SEO INFOGRAPHICS AND WHY THEY MATTER IN 2026
An SEO infographic is a visual representation of information, data, or knowledge that is specifically crafted to rank in search engines and attract organic traffic. Unlike an ordinary infographic that lives only on social media, an SEO‑focused infographic is embedded on a webpage that’s optimised for target keywords.
Why are they so valuable in 2026?
- Backlinks – High‑quality infographics are one of the most shareable content types. Other sites embed your infographic with a link back to your page, boosting your domain authority.
- Google Images traffic – Optimised infographics can appear in image search, driving a steady stream of visitors. With the rise of visual search, this traffic source is growing.
- Improved on‑page metrics – Visuals increase time‑on‑page and reduce bounce rate, both of which indirectly influence rankings.
- Rich results – Adding ImageObject schema helps Google display your infographic as a prominent image in search results.
Simply put, an SEO infographic is a dual‑purpose asset: a visual delight for humans and a data‑rich signal for search engines.
3. THE ANATOMY OF A HIGH‑RANKING INFOGRAPHIC (DESIGN & DATA)
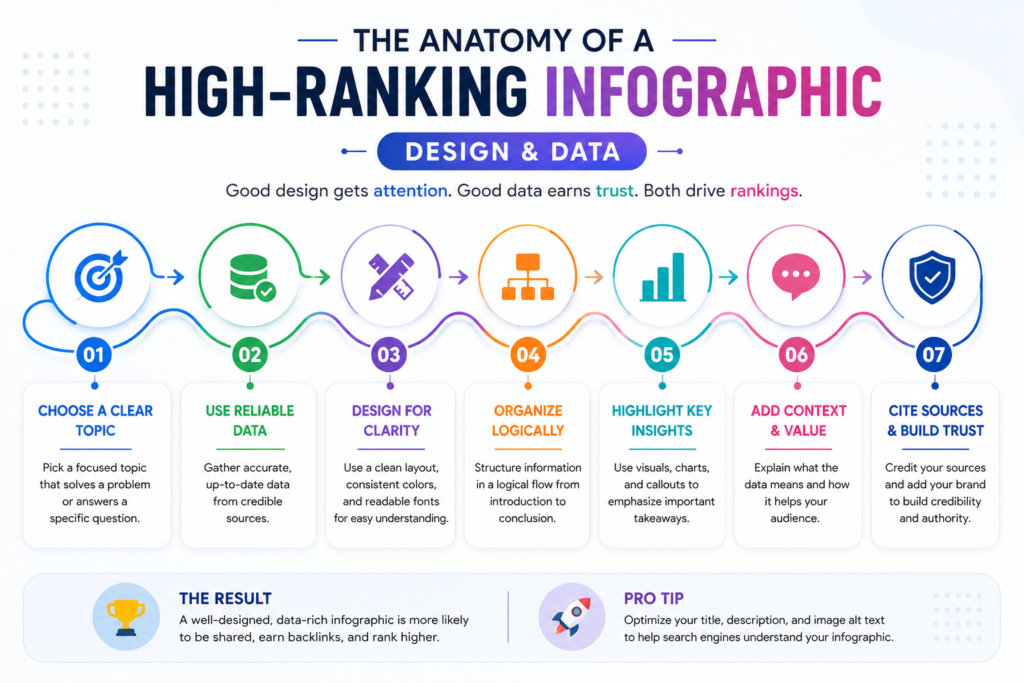
Before we dive into tools, let’s understand what separates a forgettable image from a backlink‑worthy infographic.
1. Data‑driven topic
The foundation is fresh, accurate, and compelling data. Original research, surveys, and aggregated industry statistics outperform generic listicles every time. People link to numbers they can cite.
2. Clear visual hierarchy
A strong infographic guides the eye from a compelling title, through key data points, to a conclusion or call‑to‑action. Use section headers, colour blocks, and consistent font sizes.
3. Branding (subtle but present)
Include your logo and URL at the bottom. It establishes ownership without distracting from the content.
4. Share‑friendly dimensions
The ideal width is around 800–1200 pixels. Keep the file size under 1 MB by compressing the image. PNG is best for graphics with text, while WebP offers smaller file sizes with excellent quality.
5. Embed code
Provide a ready‑made embed code (we’ll cover this later) so other bloggers can paste the infographic directly onto their site with a link.
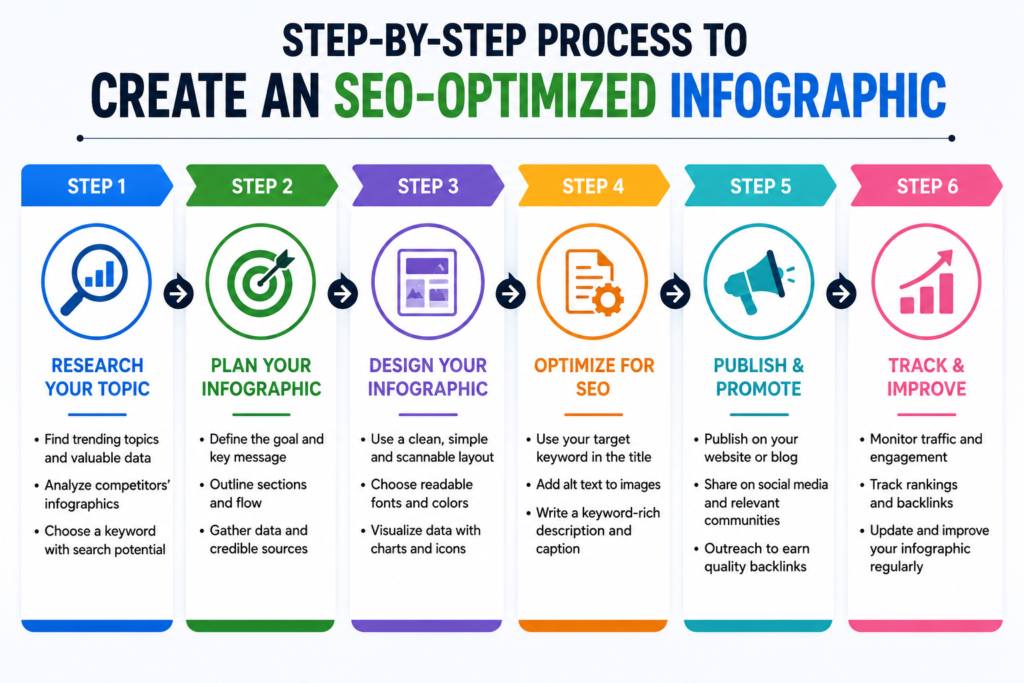
4. HOW TO CREATE AN SEO‑OPTIMISED INFOGRAPHIC: STEP‑BY‑STEP
(This section maps to the HowTo schema.)
Step 1 – Choose a data‑driven topic.
Research what’s trending in your industry. Use Google Trends, AnswerThePublic, or even Twitter/X to find questions people are asking. Gather original data or compile recent statistics from reputable sources.
Step 2 – Sketch a wireframe or pick a template.
Plan the flow: headline, introduction, key data points, visuals, and conclusion. Most design tools (Canva, Venngage, Piktochart) offer pre‑made infographic templates that you can customise.
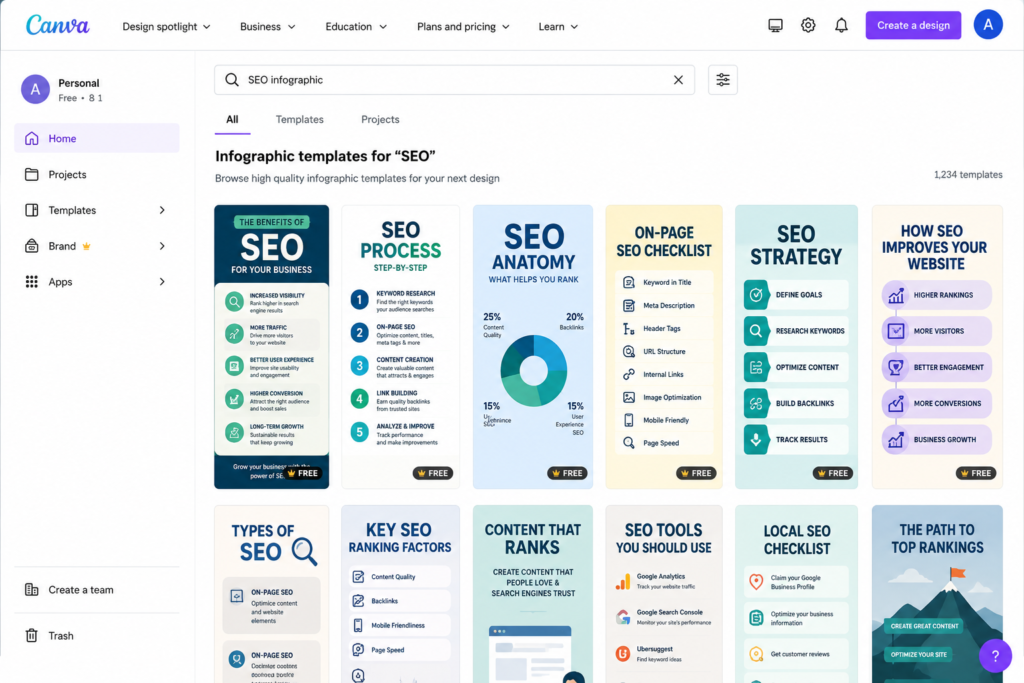
Step 3 – Design the infographic.
Use a tool like Canva (free for most features) or Visme for more advanced charts. Keep text concise; let the visuals do the heavy lifting. Use a consistent colour palette and readable fonts.
Step 4 – Export with a keyword‑rich file name.
Save the file as something like seo‑infographic‑2026‑statistics.png, not final‑v3.png. Choose PNG or WebP format, and compress the image using TinyPNG or Squoosh to keep it under 1 MB.
Step 5 – Add on‑page SEO elements.
On the webpage where the infographic lives:
- Write a descriptive alt text that includes your primary keyword (e.g., “SEO infographic showing 2026 link building statistics”).
- Use an ImageObject schema (we’ll show you how in the next section).
- Include a text introduction of 200–300 words that summarises the infographic content for search engines.
Step 6 – Create an embed code and publish.
Use an embed code generator (or simple HTML) so others can share your infographic with a link. Publish the post and start your outreach.
5. BEST FREE & PAID INFOGRAPHIC TOOLS (COMPARISON TABLE)
| Tool | Free Plan | Best For | Key Features |
|---|---|---|---|
| Canva | Yes (extensive) | Beginners & non‑designers | Drag‑and‑drop editor, infographic templates, brand kit, animations |
| Piktochart | Freemium (3 free projects) | Data‑heavy infographics | Charts, graphs, map integrations, easy CSV import |
| Venngage | Freemium (5 free designs) | Professional business visuals | Over 7,500 templates, accessibility checker, team collaboration |
| Visme | Freemium (up to 5 projects) | Interactive infographics | Video embeds, pop‑ups, analytics, wide template library |
| Easelly | Freemium (limited templates) | Simple educational infographics | Quick design for beginners, basic elements |
| Infogram | Freemium (10 projects) | Interactive charts & maps | Live data import, embedding with interactive elements |
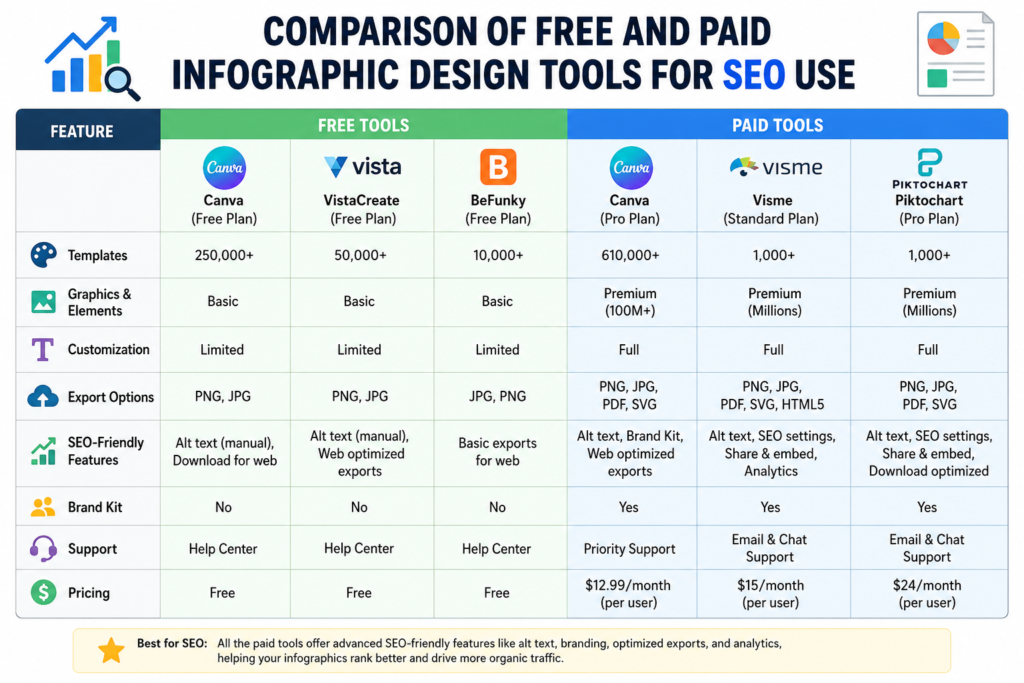
Our recommendation: Start with Canva for quick, visually appealing infographics. If you need complex data visualisation, Piktochart or Infogram are excellent choices.
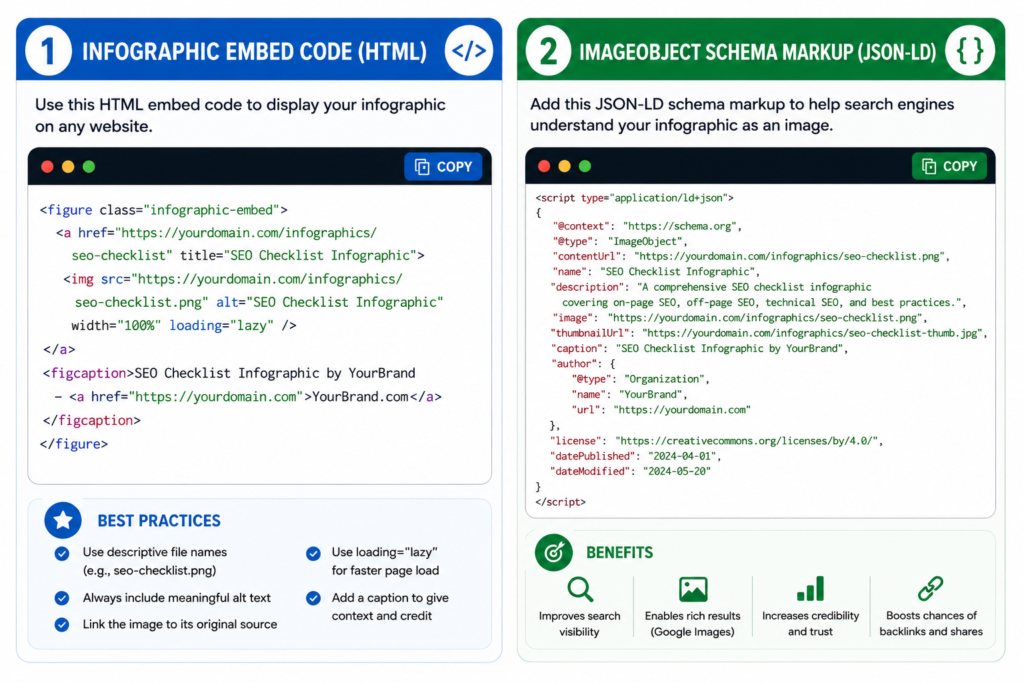
6. ON‑PAGE SEO FOR INFOGRAPHICS: ALT TEXT, FILE NAMES, AND SCHEMA
The most beautiful infographic is worthless for SEO if the page it sits on isn’t optimised. Here’s a checklist:
Alt text – Write a concise, descriptive sentence that includes your target keyword. Follow Google’s image best practices for additional guidelines. Avoid keyword stuffing. Example: alt="SEO infographic showing 12 link‑building strategies for 2026".
File name – As mentioned, use a descriptive, hyphenated file name. Google reads file names as a relevance signal.
Image file size – Compress to under 1 MB. Core Web Vitals (especially LCP) penalise slow‑loading images.
Image caption – Use the <figcaption> HTML tag to provide context. The caption is indexed and can help rankings.
ImageObject schema – Add structured data so Google can display your infographic as a rich image result. Here’s a sample schema snippet:
jsonCopyDownload
{
  "@context": "https://schema.org",
  "@type": "ImageObject",
  "contentUrl": "https://yourdomain.com/infographic.png",
  "license": "https://yourdomain.com/terms",
  "acquireLicensePage": "https://yourdomain.com/licensing",
  "creditText": "Your Brand",
  "creator": { "@type": "Organization", "name": "Your Brand" },
  "copyrightNotice": "© 2026 Your Brand"
}
Add this to your page’s JSON‑LD or via a plugin like Rank Math.
7. INFOGRAPHIC PROMOTION & LINK BUILDING STRATEGIES
Creating the infographic is half the battle; promoting it is where the backlinks roll in.
1. Outreach to relevant blogs
Find websites that have previously shared infographics on similar topics. Send a personalised email explaining why your visual adds value. Include the embed code.
For more advanced promotion tactics, see this comprehensive infographic SEO guide.
2. Leverage HARO (Help a Reporter Out)
Journalists often need data‑driven visuals for stories. Pitch your infographic as a resource; you’ll earn high‑authority backlinks from news sites.
3. Share on visual platforms
Pinterest, Instagram, and LinkedIn SlideShare (now integrated into LinkedIn posts) are goldmines for infographic distribution. Optimise your pin descriptions with keywords.
4. Submit to infographic directories
There are still reputable infographic submission sites that can drive referral traffic and backlinks. Just ensure they are niche‑relevant and not spammy.
5. Repurpose into a video or carousel
Turn the infographic into a short animated video for TikTok or an Instagram carousel. Link back to the full version on your site.
6. Embed code strategy
Provide a simple HTML snippet that includes a link back to your page. Most websites will copy‑paste it without removing the attribution.
8. MEASURING THE SUCCESS OF YOUR INFOGRAPHIC CAMPAIGN
You can’t improve what you don’t measure. Track these KPIs after publishing:
- Backlinks gained – Use Ahrefs, Semrush, or Google Search Console to monitor new referring domains.
- Organic traffic – Check the page’s traffic in Google Analytics; look for spikes after promotion.
- Image search clicks – In Search Console, filter by “Search type: Image” to see how many clicks your infographic generated.
- Social shares – Use a social listening tool or manually track shares on Twitter, LinkedIn, and Pinterest.
- Embed referrals – Use UTM parameters in the embed code link to track traffic from sites that embed your graphic.
A successful infographic can keep earning backlinks for months or even years, unlike a standard blog post that may decay quickly.
9. COMMON INFOGRAPHIC SEO MISTAKES TO AVOID
- No supporting text – Posting an image without an accompanying article is a wasted opportunity. Google needs text to understand context.
- Missing alt text – Without alt text, your infographic is invisible to screen readers and search engine bots.
- Huge file size – An uncompressed PNG can be several megabytes, killing page speed and Core Web Vitals scores.
- Generic file name –
IMG_001.PNGtells Google nothing. Always rename it. - Ignoring schema markup – ImageObject schema is a quick win that very few competitors use.
- Poor topic choice – If the data isn’t interesting or original, nobody will link to it.
- Over‑branding – A massive logo in the middle screams “advertisement” and discourages sharing.
10. FREQUENTLY ASKED QUESTIONS
1. What is an SEO infographic?
An SEO infographic is a visual piece of content designed to rank in search engines and attract backlinks. It combines compelling data with optimisation techniques like keyword‑rich file names, alt text, and structured data.
2. How do infographics help with SEO?
Infographics earn backlinks when other sites embed them, driving referral traffic and improving domain authority. They also appear in Google Images and can enhance on‑page engagement signals.
3. What are the best free tools to create SEO infographics?
Canva, Piktochart, Venngage, and Visme all offer generous free plans with infographic‑specific templates. They require no design experience and produce professional results.
4. How do I optimise an infographic for search engines?
Use a descriptive file name, add keyword‑rich alt text, compress the file for fast loading, include a text summary on the page, and implement ImageObject schema markup.
5. Can infographics improve backlinks?
Yes, infographics are one of the most effective linkable assets. When you provide an embed code with a link, other sites naturally link back to you as they share the visual.
6. What file format is best for infographic SEO?
PNG is ideal for graphics with text because it preserves clarity. WebP offers smaller file sizes with good quality and is supported by all modern browsers, making it excellent for faster load times.
7. Should I include text in the infographic or on the page?
Both. The infographic itself should have concise text labels and data. The webpage should include a full text introduction and possibly a transcript, so search engines can index the content.
8. How can I promote my infographic to get links?
Outreach to relevant bloggers, use HARO to connect with journalists, share on visual platforms like Pinterest and LinkedIn, and submit to reputable infographic directories.
9. Are infographics still effective for SEO in 2026?
Absolutely. With Google’s increasing focus on visual content and image search, a well‑optimised infographic can drive consistent organic traffic and links long after publication.
10. How do I measure the SEO impact of an infographic?
Track new backlinks in Google Search Console or a third‑party tool, monitor organic traffic to the infographic page, check image search clicks, and tally social shares and embed referrals.
11. CONCLUSION
SEO infographics are not a trend of the past – they are a timeless content format that, when correctly executed, delivers backlinks, traffic, and authority. By following the step‑by‑step creation process, leveraging free design tools, and applying on‑page SEO best practices (especially alt text and schema), you can build assets that work for you around the clock.
The key is to think of an infographic as more than a picture: it’s a data‑driven story, a link magnet, and a visual gateway to your brand. Bookmark this guide, and revisit it each time you plan a new visual campaign. For more SEO‑friendly visual tools, explore our collection of Free SEO Tools to enhance your content.